In the Gauge tab, you can add a panel of gauges to a report.
There are four different types of gauges you can create:
Radial Radial 2


Animated Half Circle Animated Half Circle with KPI’s


Linear
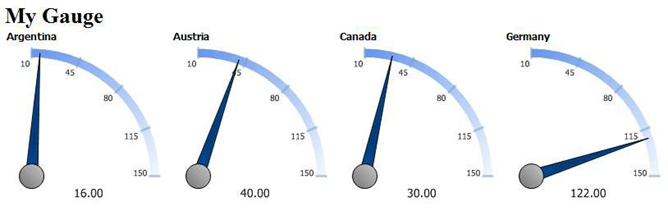
7.1 Create First Four Gauges Alphabetically Counting Orders by Country
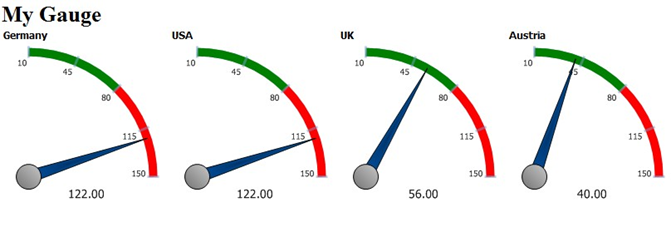
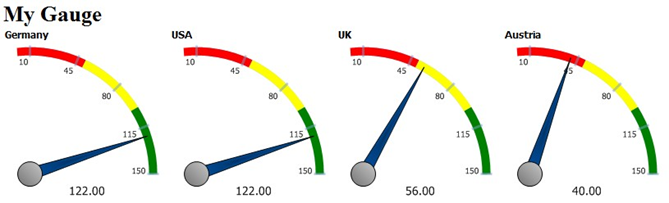
The Report below is showing the first 4 gauges based on the alphabetical order of the selected countries.
Gauge tab contents
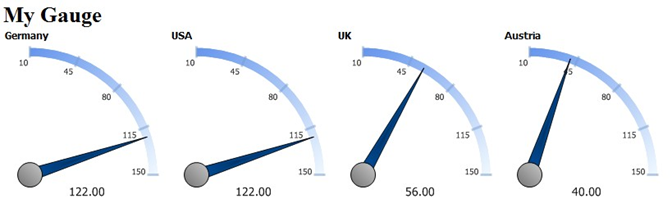
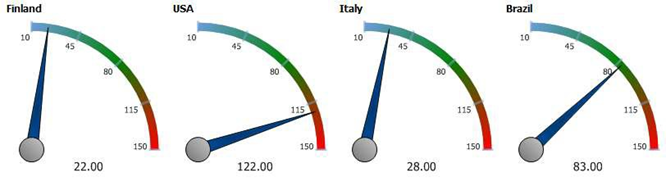
7.2 Creating the Top 4 Orders by Country Gauges
In the following example, you will see the gauges of the four countries with the greatest number of orders.
You can add four different types of gauges

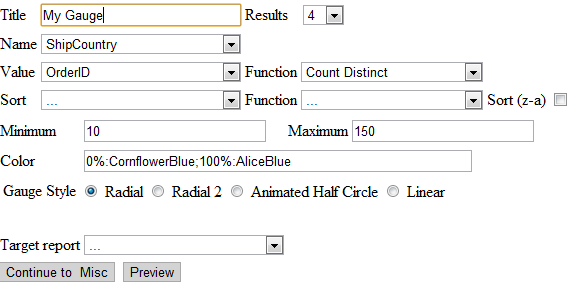
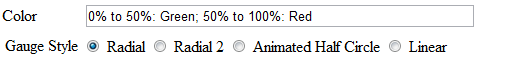
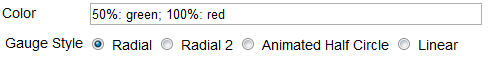
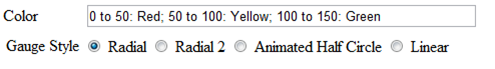
7.3 Changing Color Ranges
To change color ranges for the gauge, enter in a percentage range for each color, or enter a range of specific values.
OR
OR
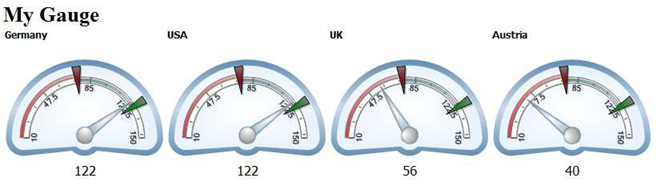
7.3.1 KPI’s and auto-updating data with Animated Gauges
The Animated Half Circle opens up a few more options under the Gauge Style row. With these new options, you can select the KPI Low and High, and select whether the Red values will be hidden, on the low side, or on the high side. You can also select how update the date updates.

7.4 Gauges with Drill-Down Effects
